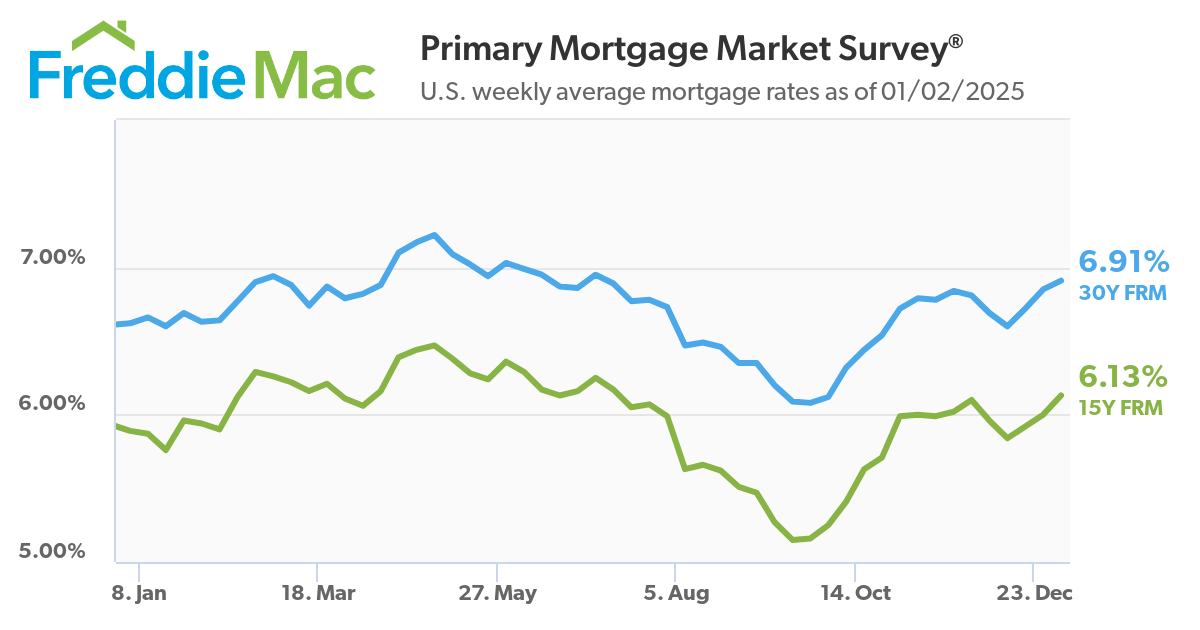
The 2024 housing market started on a positive note: inventory was on the rise, mortgage rates had fallen from a 23-year high of 7.79% in October 2023 to the mid 6% range, and homebuyers had returned to the market, with U.S. existing home sales posting back-to-back monthly increases for the first time in more than two years in January and February. But rates soon began to climb, topping 7% in April, and buyers
pulled back, causing sales to slump during the traditionally busy spring buying season.
Summer arrived, and with it came a surge of new listings, pushing inventory to its highest level since 2020, according to the National Association of REALTORS®. Although buyers had more options to choose from in their home search, the additional supply did little to temper home prices, which continued to hit record highs nationwide, and sales remained slow. Eventually, mortgage rates began to ease, falling to a
yearly low of 6.08% in September, and with inflation moving toward its 2% target, the Federal Reserve initiated a series of interest rate cuts, dropping the benchmark rate one full percentage point. Buyers took advantage of lower borrowing costs and a greater supply of homes on the market, leading sales of existing homes to surge in October and November, marking the first time since May that home sales exceeded four million units.
Sales: Pending sales increased 4.8 percent, finishing 2024 at 10,116. Closed sales were also up 4.8 percent to end the year at 10,069.
Listings: Comparing 2024 to the prior year, the number of homes available for sale was lower by 2.2 percent. There were 1,412 active listings at the end of 2024. New listings increased by 18.1 percent to finish the year at 14,252.
Distressed: In 2024, the percentage of closed sales that were either foreclosure or short sale increased by 169.6 percent to finish the year at 6.2 percent of the market.
Prices: Home prices were up compared to last year. The overall median sales price increased 7.0 percent to $990,000 for the year. Single-Family Detached home prices were up 10.8 percent compared to last year, and Single-Family Attached home prices were up 7.1 percent.
List Price Received: Sellers received, on average, 98.7 percent of their original list price at sale, a year-over-year decrease of 0.2 percent.
Economists are projecting a more active housing market in 2025.
Existing-home sales are predicted to increase, as are home prices, albeit at a moderate pace. Mortgage rates will vary throughout the year but will likely stay within the 6% – 7% range. Buyers and sellers remain sensitive to fluctuations in mortgage rates, and the trajectory of rates will have a major impact on market activity. Inventory of new and existing homes will continue to improve in the new year, building on the supply gains made in 2024, with increases in both single-family and multifamily construction expected, according to the National Association of Home Builders.
The numbers by city:
These #’s are for Single Family Detached homes and do not include Attached Homes, aka condos and townhomes.
DOM = Days on Market
% List Price = Percentage of the original list price that the home sold for.
Carlsbad:
| Month | Avg Sold $ | Chg | DOM | Chg | Sold Homes | Chg | Active Listings | Chg | % List Price | YoY Chg |
|---|---|---|---|---|---|---|---|---|---|---|
| 12/24 | $1,899,000 | -1% | 31 | 0% | 153 | 3% | 116 | -16% | 97.3% | -5.7% |
| 11/24 | $1,926,000 | -1% | 31 | 15% | 149 | -13% | 138 | -5% | 96.5% | 7.3% |
| 10/24 | $1,938,000 | -1% | 27 | -4% | 171 | -9% | 146 | 16% | 96.4% | 9.0% |
| 09/24 | $1,950,000 | 1% | 28 | 17% | 188 | 8% | 126 | -2% | 96.6% | 10.9% |
| 08/24 | $1,934,000 | -1% | 24 | 9% | 174 | -5% | 128 | 2% | 97.5% | 6.6% |
| 07/24 | $1,948,000 | -3% | 22 | 22% | 183 | 2% | 125 | 7% | 98.9% | 4.7% |
| 06/24 | $1,999,000 | -1% | 18 | -5% | 179 | -5% | 117 | 17% | 100.0% | 4.1% |
| 05/24 | $2,024,000 | -1% | 19 | -5% | 189 | 11% | 100 | 18% | 100.4% | 6.5% |
| 04/24 | $2,039,000 | 4% | 20 | -17% | 171 | 20% | 85 | 8% | 100.5% | 13.7% |
| 03/24 | $1,960,000 | -3% | 24 | -4% | 142 | 21% | 79 | 5% | 100.1% | 18.3% |
| 02/24 | $2,024,000 | 1% | 25 | -14% | 117 | 17% | 75 | -12% | 99.4% | 27.0% |
| 01/24 | $2,005,000 | -0% | 29 | 12% | 100 | -2% | 85 | -6% | 97.7% | 25.5% |
| 12/23 | $2,013,000 | 12% | 26 | -4% | 102 | -20% | 90 | -10% | 96.9% | 24.0% |
| 11/23 | $1,795,000 | 1% | 27 | 23% | 128 | -15% | 100 | 4% | 97.2% | 13.1% |
| 10/23 | $1,778,000 | 1% | 22 | 16% | 151 | -19% | 96 | -5% | 98.3% | 10.2% |
| 09/23 | $1,759,000 | -3% | 19 | 27% | 186 | -3% | 101 | -3% | 98.5% | 3.3% |
| 08/23 | $1,815,000 | -2% | 15 | 7% | 191 | 7% | 104 | 1% | 99.6% | 0.7% |
| 07/23 | $1,861,000 | -3% | 14 | 0% | 179 | 15% | 103 | 6% | 100.0% | 2.2% |


